From MuIS Data to a Research Application for the Finno-Ugric Object Collection

This workflow describes how to transform metadata from the Estonian National Museum’s Finno-Ugric object collection, obtained from the Estonian Museums Information System (MuIS), into a structured, research-ready dataset and use it to create an interactive web application. The aim is to enable research on the Finno-Ugric object collection by ethnic group, material, collector, collection date and geographical origin. The source data come from an RDF export from MuIS and contain information about museum objects. Since museum data have accumulated over a long period and under different cataloguing practices, the original data are not immediately comparable or suitable for analysis and visualization.


In this workflow, I converted RDF data into tabular form, checked and cleaned the metadata, and enriched them with attributes needed for analysis and visualization. An important part of the process involved comparing automatically extracted data against the original MuIS records and linking historical place information to present-day place names. The result is a set of interlinked data tables and a Streamlit research application.

Workflow steps

Keywords: Discovering, exploration

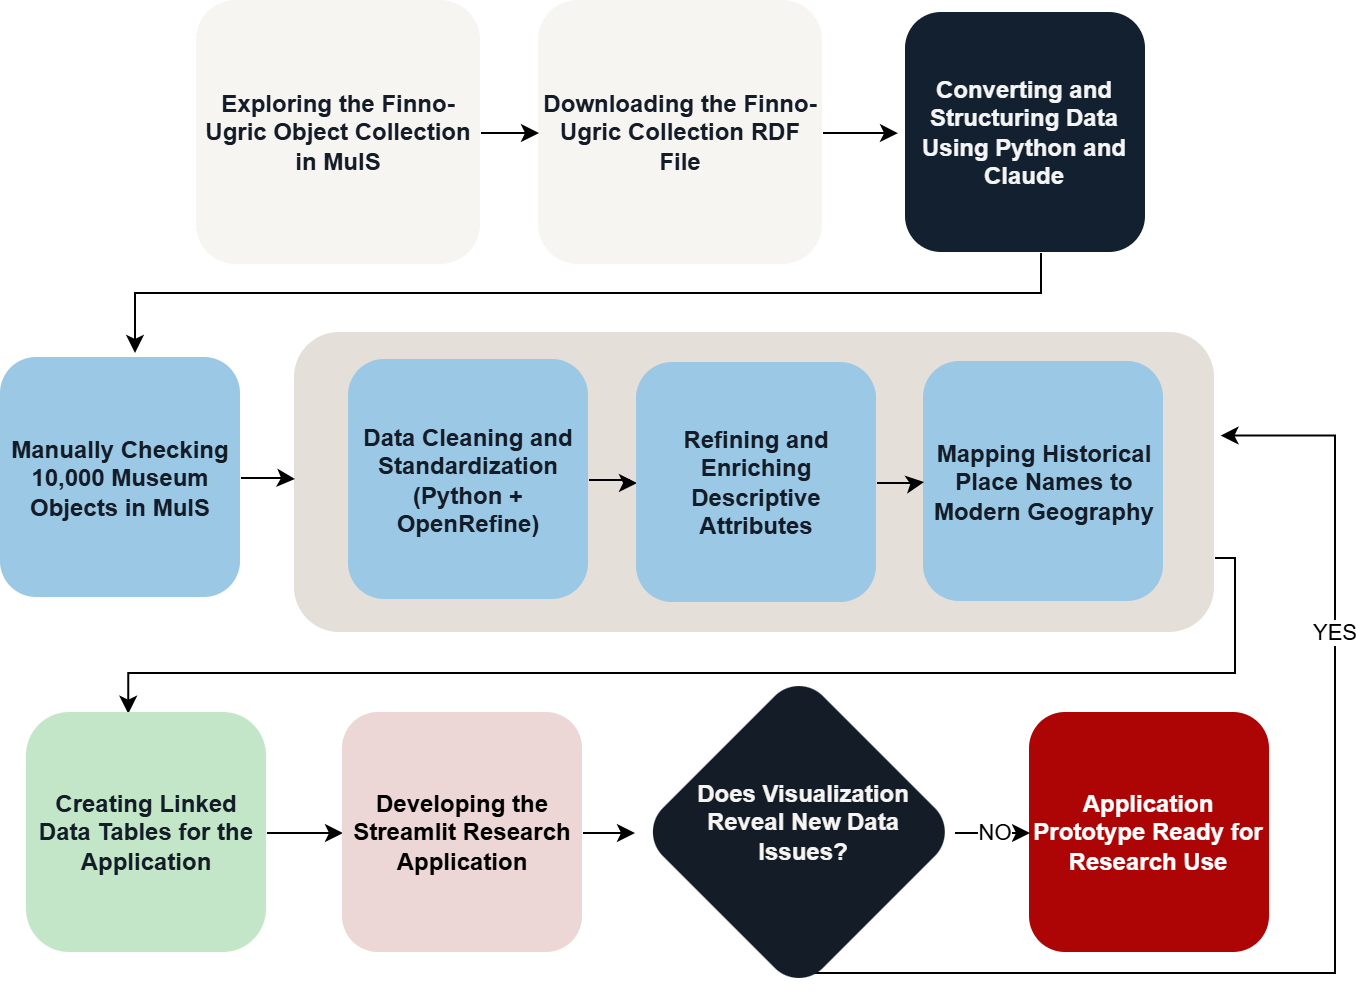
In the first stage, I explored the metadata of the Estonian National Museum’s Finno-Ugric object collection held in the Estonian Museums Information System (MuIS). I obtained the source data by running a search at www.muis.ee that displayed all 10,000 museum objects belonging to the Finno-Ugric object collection. I saved the search results using the MuIS interface function “Save results as RDF” (“Salvesta tulemused RDF kujul”). The resulting RDF contains references to the collection’s museum objects as interconnected records and properties, and serves as the starting point for subsequent automated data processing.

At this stage, I also assessed the overall structure and limitations of the source data. I paid attention to missing values, differing ways of recording the same type of information, and the organization of information about museum objects within the RDF. My objective was not yet to correct the data but to understand how the collection was documented and which information could be structured, compared and visualized in later stages.

Keywords: Converting, parsing, organizing

I processed the RDF file exported from MuIS using Python. First, I extracted references to museum objects from the RDF file and used them to access individual object records. I then programmatically extracted information from structured RDF fields, including object numbers, names, materials and associated events. Each museum object became the central unit of the dataset, identified by a unique object_id that links the same object across different tables.

Some of the information needed for research was contained in free-text descriptions in MuIS. For initial structuring of this information, I used the paid Claude AI API: I prompted it to extract place names, ethnicity, collection dates and collectors from the text in an object’s comments field and return the information in a structured format. To standardize collection dates, I also used Python rules to convert dates written in different formats into a standard form where possible. I used both Claude and ChatGPT as aids in developing the code. AI-assisted information extraction was an experiment in initial structuring, not a final result considered reliable or a mandatory step for reproducing the workflow.

Keywords: Data cleansing, correcting, supplementing

After the automated conversion, I assessed the quality of the resulting tables. I found that the information extracted with Claude through Python was neither complete nor reliable enough: some values were missed, others were placed in incorrect fields, and information extracted automatically from more complex MuIS records was not always unambiguous. Some object records also had genuinely empty fields. I therefore compared the structured dataset with the original source. For validation, I reviewed almost 10,000 objects in the collection individually in MuIS. This took approximately two months. I compared the information in the structured tables with the MuIS object records, correcting and supplementing information relating primarily to collectors, places, collection dates and materials. This is a key quality-control stage of the workflow: automated processing made it possible to structure a large dataset initially, but manual verification against the original source proved necessary to identify errors and missing values.

Keywords: Data cleansing, correcting, merging

After manually reviewing the museum objects, I began systematically cleaning and standardizing the validated dataset. I used Python and OpenRefine for this purpose. For example, I standardized different spellings of values with the same meaning, removed or corrected obvious errors, checked for duplicates, and harmonized data formats. OpenRefine makes it possible to cluster similar text values and correct them in batches; I used Python to process larger tables and automate repeated transformations.

At this stage, it is important to distinguish technical standardization from substantive enrichment. For example, if the same material, person or place appears under different spellings, these values can be standardized after verification. Missing or uncertain information, however, was not inferred merely from other records. Cleaning produced more consistent tables that could then be further enriched, linked and analyzed.

Keywords: Annotating, associating, supplementing

In the next stage, I organized substantive attributes relevant to analysis. For materials, I linked narrower categories to broader material categories while retaining the detailed material value. I also checked cases where a value recorded as a material actually referred to a manufacturing technique, a component of an object or another property. In the data on ethnicity, I distinguished between a broader ethnic designation and, where possible, a more specific ethnic group, so that details in the source data would not be lost through generalization.

When checking missing or ambiguous values, I drew on the object’s collection context where necessary. Other objects from the same expedition or collection group may provide important additional information for interpreting an incomplete record, but I did not apply such associations automatically: I checked possible exceptions separately. I also used earlier research tables from the Estonian National Museum that contained additional details about ethnic groups. For example, unlike MuIS, these tables distinguish Hill Mari and Meadow Mari objects, and Perm Komi and Zyrian Komi objects, as well as their origins. The aim was to make the data more comparable while preserving, where possible, the distinction between information from the original source and information added or normalized during processing.

Keywords: Georeferencing, spatial analysis, contextualizing, mapping

Collection locations are described in MuIS using administrative divisions from different periods and at varying levels of precision: country, governorate, autonomous republic, oblast, district, municipality or village (or village council). The same place may appear in several languages or under different spellings. I therefore extracted place names from the object descriptions and brought them into a comparable structure, distinguishing the country, region, district and, where possible, settlement level.

As a reference for present-day administrative divisions, I used datasets of administrative units published on official open-data platforms in Russia and Latvia. I compiled the regions and districts mentioned in the original object descriptions and compared their names and administrative affiliations with the reference datasets. Python allowed me to compare spellings, repeated values and relationships between tables systematically. I checked substantive matches separately, particularly where historical administrative divisions differed from current ones, where the same village name occurred in several locations, or where a description was contradictory. Where necessary, I consulted additional administrative sources and revisited the particular object’s MuIS record. In some cases, no precise location was recorded at all.

In matching locations, I gave precedence to the detailed location description of the individual museum object over a general location assigned to an expedition or collection. I retained the original place name and recorded the present-day equivalent separately, together with its level of precision: country, region, district or settlement. If only the region could be substantiated, I did not add a district or village based on conjecture. The result was a verifiable place-name mapping table that could be linked to the object data and refined later if necessary.

Keywords: Modeling, data mapping, merging

Using the tables created and cleaned in earlier stages, I built the final data model for the application. The main object table contains one record per object; repeated attributes, such as materials and collectors, are stored in separate long-format tables; and I linked normalized geographical information to objects through object_id. This structure made it possible to handle cases in which a single museum object has several materials or other repeated attributes correctly.

While creating the data model, I checked that joining the tables would neither artificially multiply museum objects nor cause records to be lost. I also prepared the attributes used by the application to filter, group and visualize the collection. This stage connected the earlier data preparation with application development: I turned the cleaned metadata into a structure that an interactive research tool could use consistently.

Keywords: Web development, data visualization, mapping

Using the cleaned data, I created a Streamlit web application that allows users to explore the Estonian National Museum’s Finno-Ugric object collection without having to process the underlying data tables themselves. The application allows museum objects to be filtered by ethnicity and ethnic group, material and material category, collector, collection date and geographical location. The map view makes it possible to examine the distribution of objects across countries and present-day Russian regions and districts, and to view objects associated with a selected area.

To develop the application, I used Streamlit, a Python framework that supports the creation of interactive web applications without having to program a user interface from scratch. With Streamlit, I combined the prepared data tables with filters, charts, object overviews and network views of collectors. The application’s source code, the structure of its data tables and instructions for running it are available in a public GitHub repository.

The web version of the application is published on Streamlit Community Cloud, allowing it to be used without installing the software on a computer. The current research application is a prototype whose primary target audience is researchers. It aims to support systematic research on the Estonian National Museum’s Finno-Ugric object collection and offers ways to compare and filter museum objects and analyze relationships between them.

Future development plans include extending the application’s functionality, improving the quality of the underlying data and making the interface multilingual. In the longer term, the application could also serve Finno-Ugric communities themselves, allowing them to explore their cultural heritage and the objects preserved in the collections of the Estonian National Museum.

Thus, the application currently aims to support scholarly research, while further development could also improve the accessibility and usability of the collections for communities of origin.

Developing the application also serves as a means of checking data quality. Filters, summary counts, tables and maps reveal inconsistencies that are difficult to notice when inspecting individual data rows: for example, different forms of the same regional name, unexpectedly missing categories or incorrectly linked administrative units. When I find such issues, I return to the earlier stages of cleaning, enrichment or geographical normalization. The workflow is therefore iterative: visualization helps validate the data, and corrected data in turn improve the visualizations.