
We are working with the Estonian runosongs' database, which contains runosong texts and the metadata associated with them. The aim of the project is to study the geographical distribution of work songs containing references to grain types and to analyse which grains are mentioned most frequently in different regions. Through the analysis, we aim to identify possible regional patterns and examine how and whether runosongs might reflect historical agriculture.
Runosongs' database contains various types of metadata, including song titles, themes, song texts, places of collection, collectors, performers, and dates of collection. It is important to note that not all types of metadata are fully available for every song.
- Authors:
- Mirelle Kiholane (University of Tartu)
- Helena Kalm (University of Tartu)
- Licence: CC-BY-4.0
- Date/version: 29.05.2026
- Subject field: folkloristics
- Data media type: text, metadata
- Keywords (content): grains, runo songs
- Keywords (Tadirah): Collating, content analysis, georeferencing, data visualization, plotting, lemmatizing, data mining
- Output: dataset, data visualization
- Workflow origin: course "Cultural Data project"
- Related materials:
- Mirelle Kiholane, Helena Kalm. Analysis of the distribution area of Estonian agricultural runosongs. Cultural Data Project, University of Tartu/Estonian Literary Museum, 2026.
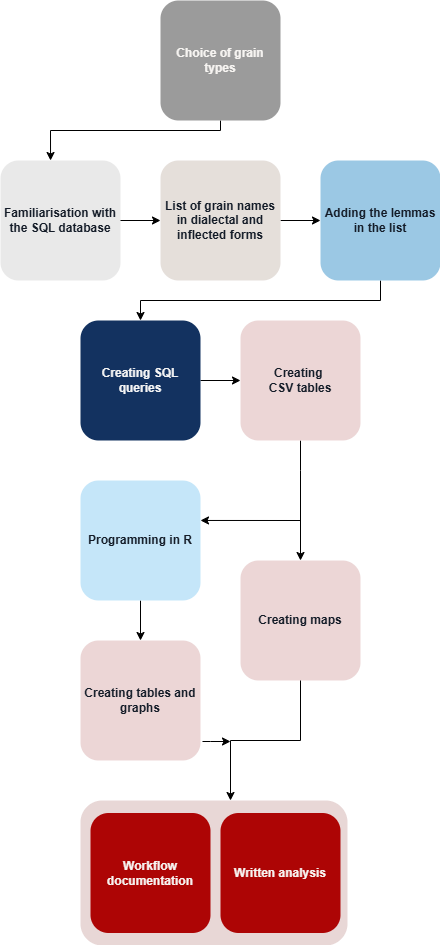
Workflow steps
Keywords: Browsing, searching, information retrieval
The aim of the first stage was to determine which grains could be used for the analysis. Identifying these was the basis of our work, since database queries cannot be made without precise inputs. The initial selection of types of grain was developed in cooperation with the mentor, from whom we asked which grains have historically been the most important in Estonia. The resulting list consisted of wheat, oats, buckwheat, rye, and barley. We found that a list of five types of grain would be sufficiently comprehensive for this project. The first SQL queries and visualisations were made using these grains in order to check their presence and word forms. In the third stage, this list was expanded in cooperation with the content mentor to include Estonian dialectal and inflected forms.
Keywords: preprocessing, exploration
At this stage, we became familiar for the first time with the FILTER databaseused in the project. Before making queries, we read the accompanying additional materials, such as the database schema and user guide, in order to understand the general structure and the logic of query creation. Becoming familiar with the database enabled us to define clearer goals and establish a system for creating queries in the following stages.
Keywords: Preprocessing, lemmatizing, transformation
This stage focuses on the inflected and dialectal variants of the selected grains. Since runosongs contain dialectal forms and historical language use, it was necessary to compile an expanded list of word forms. This helped reduce situations in which important textual information would be missed because of an overly simplified keyword search. Word inflections also have to be taken into account, as they make word search more difficult. For this purpose, the content mentor shared with us a list that included most of the dialectal and inflected variants of wheat, oats, rye, barley, and buckwheat. This list was cleaned with the help of ChatGPT in order to group the variants under the corresponding grain type, which would later be needed for word search in the SQL code and for compiling tables.
Keywords: Data visualization, querying, data mining
The aim of this stage was to create an SQL script that would find Estonian-language runosongs in the FILTER database with the subcategory of work songs, mentioning our selected words, together with the locations of the songs.
The choice to focus only on work songs was made because, in the course of our work, we wanted to see where these grains were cultivated in agricultural contexts. We therefore excluded other song types that might contain these grain types, since they were not substantively relevant to our project. The SQL database program DBeaver was used to write the script. For this, we used the tables identified in the second stage, which contained information important to us, such as words, location, and ID values from specific tables. ID values make it possible to create links between different tables, combine data from different tables, and create one new table. For word search, we used the list created in the previous stage, divided by grain names, so that the table would immediately include the base form of the word.
Several different tables were created. The tables focus on presenting different results. One table shows the occurrence of each mentioned grain in all parishes, both as a number and as a relative frequency, taking into account how many songs were collected in each parish overall and calculating a percentage value for the frequency of each grain type per 100 songs. This is important because in some regions significantly more songs have been collected, which can distort the results. There is also a table showing exactly in which song and verse the word was found, together with the original variant of the word. Another table shows the most frequently mentioned cereal in each parish and its frequency, and there is also a table in which the frequencies of cereals are added together and, on that basis, the relative frequency is calculated for each parish. These data were downloaded as CSV files
which can later be used to create visualisations such as maps and tables. These tables are also an important part of the final analysis, because they show which cereals were important in which places, together with their
frequencies.
Keywords: plotting, programming, diagramming
The aim of this stage was to create visualisations based on the tables generated with the SQL script, making it possible to see and analyse more clearly the regional distribution of songs related to grain cultivation and the frequency of occurrence of different grain types. The visualisation was carried out in RStudio using the packages ggplot2, dplyr, and tidyverse. R was chosen because of previous experience with it, and also because it allows the data to be processed precisely before visualisation and produces figures that are reproducible through code. To make the data easier to compare, they were normalised. The occurrences of all cereal types in each region were added together and divided by the total number of songs from that region. The result was a percentage showing the share of songs related to grain cultivation among all songs collected from the region. In addition, a minimum threshold was established: only regions where at least 30 songs had been collected were included in the analysis. The choice of threshold was based on the results of the CSV tables. This was necessary for the accuracy of the results, because in regions with a small number of songs, individual occurrences could form a disproportionately large share of the final results, thereby distorting the accuracy of the overall comparison.
Four figures were created: a bar chart showing the general frequency of occurrence of grain types, a bar chart comparing the occurrence of agricultural work songs, a stacked bar chart showing the share of grain types by region, and a heatmap giving an overview of all grain-type and region combinations. For diagrams containing regions, the results were calculated for the 20 regions with the highest shares. This stage was directly based on the SQL script created in the previous stage, which produced the normalised summary tables needed for the analysis. The figures from this stage also support the maps created in the following stage and make it possible to see the numerical results more clearly.
Keywords: data visualization, georeferencing
This stage focuses on visualising the completed data tables in order to create interactive maps showing locations and the occurrence of cereals in the specified places. The website Datawrapper was used to create the interactive maps, as it allows users to upload their own data and process them easily on a selected map with little code. Datawrapper supports Estonian-language data and also offers various maps of Estonia, but for our data we needed a map of Estonia that included historical parishes that no longer exist today. In the map application of the Estonian Land Board geoportal, we found a historical map of Estonian parishes, showing parishes up to 1917, which matched our data almost perfectly. We downloaded this map as a GEOJSON file and uploaded it to Datawrapper. This made it possible to visualise the data according to our locations. It should be noted that Setomaa was missing from the map and had been included under Vastseliina. Since the Setomaa data were significantly larger than the Vastseliina data, we decided to use the Setomaa data in the place of Vastseliina on the map.
A total of three maps were created. “Occurrence of grain types per 100 songs” shows for the runosongs of each parish the most frequently mentioned grain, its relative frequency in percentages, and the number of occurrences. This visualisation makes it possible to see which parishes may have been more important in Estonian grain cultivation and which cereals they may have been associated with. “Frequency of grain mentions in parishes” shows the frequency of grains mentioned in the runosongs of each parish, considering all the grain types together. Data were included only from parishes where at least 30 songs had been collected, because smaller results can make relative frequency unstable. This map shows which parishes may have been most important in grain cultivation, considering the selected grain types. The third map shows the mention frequency of each grain type in each parish, displaying the most frequently mentioned grain for each parish and using colours to distinguish the grain types. This map helps visualise larger regions that were associated with the grains mentioned in the songs.
Keywords: Content analysis, comparing, explanation
Agricultural songs containing the selected grains were most widespread primarily in Central, Southern, and South-Eastern Estonia. This result may indicate that grain cultivation played a more important role in these regions than elsewhere in Estonia. Runosongs were connected with everyday work and farm life, and their wider distribution may point to a stronger traditional influence of agriculture in these regions. At the same time, it is important to note that the regional distribution of cereal mentions may be influenced by a variety of factors, such as song traditions, collecting practices, or historical patterns. The results should therefore not be interpreted as exhaustive indicators, but rather as patterns that emerged from the study.
The account of agricultural history found in the work Science in the History of the Development of Estonian Agriculture, created by the Academic Agricultural Society, partly overlaps with our results. According to this account, Viljandi County, Tartu County, and partly Järva County were among the most important agricultural regions in Estonia. Although historical accounts often emphasise the importance of rye as Estonia’s main bread grain, the present analysis showed that oats were mentioned most frequently in runosongs instead. This may indicate that runosongs do not clearly reflect agricultural importance, but rather everyday work practices and peasant life. The year in which the songs were created must also be taken into account, as this is often unclear. Rye began to gain importance in agricultural research from 1918 onward, but a large share of folk songs may represent older results. The frequent occurrence of oats may be connected with their widespread use in farm economies, for example as animal feed. Since work songs were connected with everyday farm labour, oats may have been more visible in agricultural practice than other types of grain.