Interactive map of Building Designs in Tartu

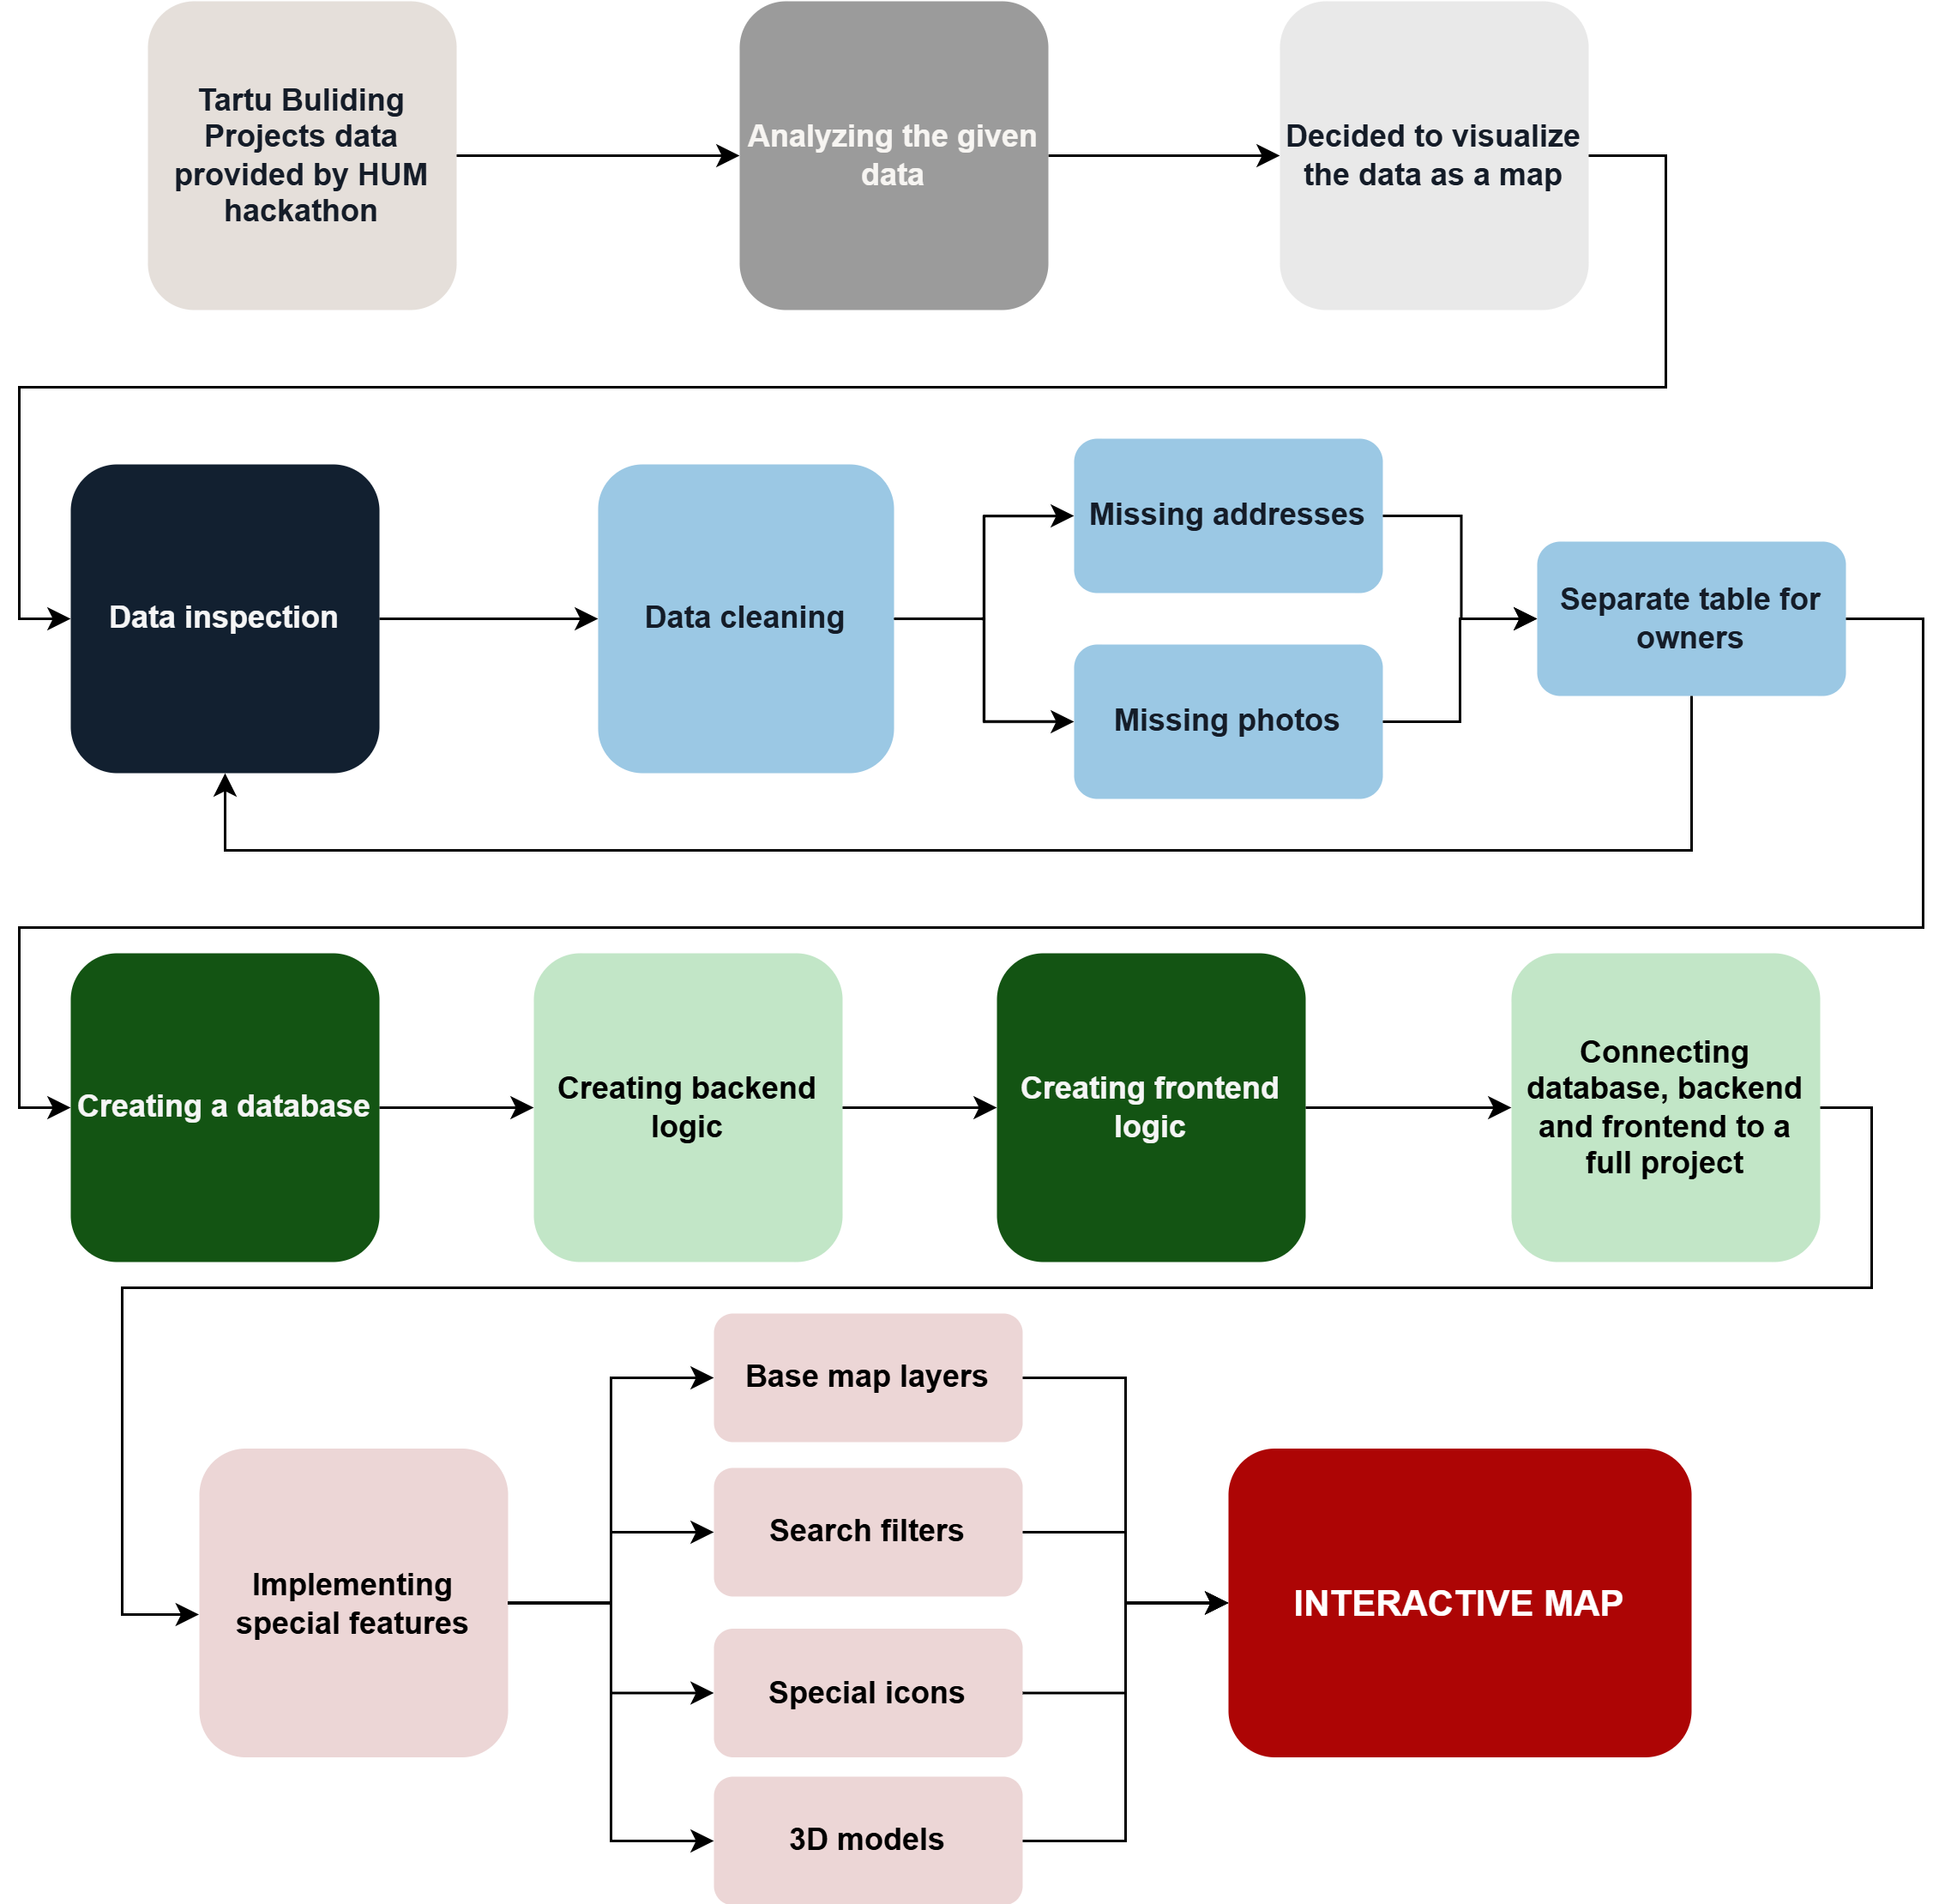
This workflow was created during the HUM hackathon and focuses on building an interactive map application based on the Tartu Building Designs database. The main purpose of this project was to visualise building projects in Tartu between 1870 and 1920. The workflow describes data processing and creating a map application.

Workflow steps

Keywords: analyzing, discussing, exploration

Before creating a map, we familiarised ourselves with the provided data. We analysed the attributes and values in the dataset and consulted with the data expert in order to better understand what we wanted to visualise on the map as the final product. To get a better overview of the dataset, we looked into the attributes provided: what type of data was given, what were the inconsistencies across the database and how many missing instances the more important features had. Analysis was mostly done using the NumPy library.

Finally, we decided on attributes with valuable data for the map. Chosen attributes were: images, address, owners, occupancy classification, city and quarter, building materials, number of floors and apartments before and after the building project, existence of water system and dry toilets, project and land lot number.

Keywords: creating, data cleansing, discussing, georeferencing, removing

After data analysis, the next obvious move was to create a database with the data. But before creating the database we had to clean the data using the NumPy library, so it would be easy to use. While inspecting the data we found a lot of instances where some crucial aspects, for example addresses and photos, were missing. After thorough consideration we decided to filter out these instances for the simplicity of the project.

At the beginning we had about 6 000 instances of Building designs in Tartu, but after a deep data cleaning we were left with about 3700 instances. In addition, we used the Python library GeoPy for geolocating all the instances we were left with and assigned latitude and longitude for every one of them. Again, since many addresses were not in a standard format (e.g. corner houses and changed street names), after geolocating we were down to 1900 instances. This is of course a big data loss, but considering the time, the manpower and the simplicity of our project this is not a problem. Finally, we were ready to create a database with the data suitable for our project.

Keywords: creating, programming

The backend was made with some vibe coding and our expertise. For clarification, the backend is not the main effort of this project. Backend is mainly simple and only includes some API requests for databases. Backend also includes the server logic and thus this project is currently only visible in a local computer with all the data including the building plans and other photos. In addition, the backend was made with python using the fastAPI library.

Keywords: creating, design, programming

We worked in parallel teams during the hackathon, so we started building the frontend using mock data. Initially, we implemented a simple filtering system and integrated a map using Leaflet library into the application. Using the mock data, we placed pins at the correct addresses, and clicking on them opened a small pop-up with additional information.

As development progressed, we adapted everything to work with real data by adding more advanced filters and basic statistics, such as the total number of houses versus those currently displayed on the map. We also introduced a legend with different icons for different types of houses. Additionally, clicking on a house icon now opens a sidebar with more detailed information, improving on the earlier pop-up view. Once the backend database was ready, we replaced the mock data and connected all components into a fully functional system.

We decided to build the application in Estonian, as our initial dataset was already in Estonian and our primary target audience consists of Estonian users and museums.

Keywords: creating, design, discussing, programming

Once the frontend and backend were integrated, we began exploring additional features and expanding beyond our initial goal of creating an interactive map. We introduced a secondary map layer, featuring a historical map of Tartu from 1927 (Maa- ja Ruumiamet), to provide additional context. We also implemented custom icons to represent different types of locations—for example, shops are marked with a shopping bag icon.

Our filtering system was improved by replacing hardcoded options with dynamic values retrieved from the database, ensuring that any newly added data would automatically be reflected in the available filters. In addition, we refined the sidebar to present information in a clearer and more user-friendly way.

Keywords: creating, design

After discussing among ourselves and with the mentors, we decided on expanding our project by adding AI generated 3D models based on blueprints. For example, we chose a building with several sketches and floor plans, asked Claude AI to reconstruct the building and added it as a feature when clicking on the pin to see further information. A 3D model was created for one building (Riia mnt. 53).