These guidelines will help you create process and methodology diagrams based on a consistent design system.
The goal is not always complete uniformity, but rather a recognizable, logical, and consistent structure.
The diagrams are created draw.io (diagrams.net) software.
General Principles
● The diagram should be readable without additional explanations
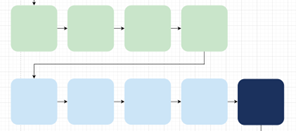
● The flow of the diagram runs from left to right and/or top to bottom
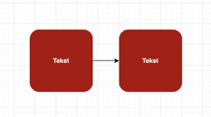
● Each box represents a single action, decision, or output
● Each selected color represents a specific stage of the process
Recommended logic for the diagram structure
The diagram does not always have to include all stages, but the general logic is as follows:
● Study planning and starting points
● Data collection
● Data preparation and cleaning
● Analysis and/or modeling
● Integration and linking
● Results and their dissemination
Guide to Creating a Diagram
1. Creating a File
1.1. Ava fail ETKAD diagrams.
1.2. On the page that opens, click the pencil icon on the right side of the bottom bar.
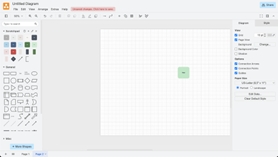
1.3. A file will open where you can begin creating your diagram.
2. Creating a diagram
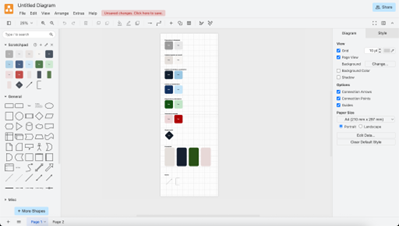
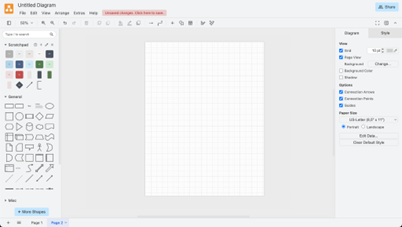
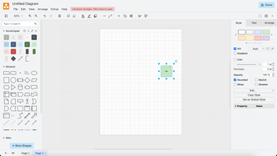
2.1 The first page of the document contains the elements needed to create diagrams. To find
To find
a blank page on which to create a diagram, click the Page 2 button in the lower-left corner of the page.

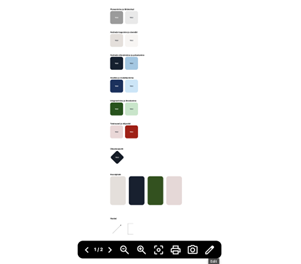
2.2 The shapes on Page 1 are divided into sections corresponding to the parts of the process.
The colors are intended as a guide rather than strict requirements, so you can adjust the use of shades
if necessary.
However, adding new colors is not recommended, as the colors are based on the ERCTI visual identity:
- Planning and starting points: gray tones (#9B9B9B and #E9E9E9)
- Data collection and inputs: beige tones (#E5DFDA and #F7F5F2)
- Data preparation and cleaning: dark blue tones (#122030 and #9BC8E4)
- Analysis and modeling: light blue tones (#133260 and #C5E6F9)
- Integration and connection: green tones (#135413 and #C2E6C7)
- Results and outputs: red tones (#ECD6D6 and #AD0505)
Additionally, you will also find:
- Decision Point
- A summary block to use when you need to group multiple elements at the same level
without emphasizing the temporal sequence between them
- Arrows
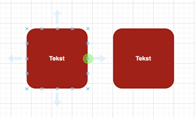
2.3 The shapes on Page 1 you can copy elements to Page 2and start creating the diagram there.
Once you have copied an element, double-click it to add text.
2.4 If you want to connect elements with an arrow, you can copy an arrow from Page 1
1, but an even simpler option is to move the mouse to the point on the element where the arrow originates, and
drag from there when the green button appears.
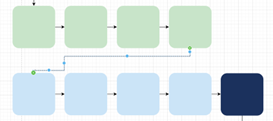
2.5 If your diagrams have multiple layers and the arrows are positioned incorrectly,
you can
adjust them by selecting the arrow and dragging the blue dots to the correct location.
2.6 The workspace automatically expands when you place a design element
beyond the edge of the workspace.
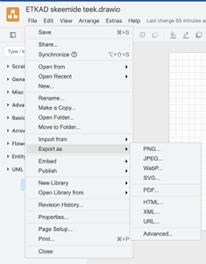
3. Exporting and Sharing
3.1 Once the diagram is ready, you can export it by selecting File
→ Export as from the top left corner of the screen and selecting the file format of your choice.
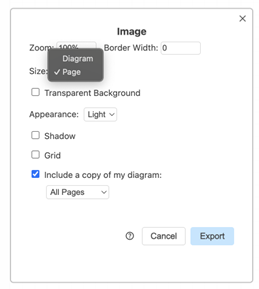
3.2 To export only the page containing the diagram (Page 2) and not the entire collection of design elements
(Page 1), make sure you are on Page 2 when exporting and select Page from the Size dropdown.
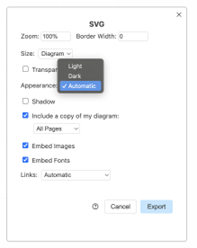
3.3 If you are exporting the file in SVG, WebP, HTML, or URL format, make sure that Appearance
is set to Light.
3.4 Save the finished file to a location of your choice.